Google’s New Core Web Vitals Metric: How To Improve INP
Google’s New Core Web Vitals Metric: How To Improve INP
-
By Shamsher Singh Bhullar
-
2nd March 2024
Now that your webpage is successfully visible on the Search Engine Result Pages (SERPs), what is the next step to success? It is the page speed. The speed of the loading page directly impacts the success of your webpage’s search.
If you want to measure the user experience for your webpage based on the loading performance, user-intuitiveness, interactivity, and stability, you must be aware of Google’s Core Web Vitals. To sum up, Core Web Vitals is a set of metrics that calculates the real-world user experience that is incurred based on the page performance.
According to Google’s recent updates, a new Core Web Vital metric will formally be in effect on 12th March 2024. This metric is called Interaction to Next Paint (INP). This guide is an in-depth introduction to the INP Core Web Vitals, how to optimize it, and test INP.
What is Meant by INP?
Interaction to Next Paint (INP) is a webpage performance metric that measures the responsiveness of a user interface. It means that this metric measures how fast a webpage responds when a user interacts with it through various actions, such as mouse clicks, keyboard presses, entering data inside a form, tapping on a touchscreen device like a smartphone, or when a page starts painting the next change on the screen.
How Do You Measure Interaction to Next Paint (INP)?
All the interactions made with a page constitute the Interaction to the Next Paint (INP) metric. When a page has an unusually high interaction or responsive rate, the rule of thumb is to ignore one highest interaction for every 50 interactions. To sum up, the interaction with the worst latency comprises the INP.
INP is calculated by finding the difference between the two timestamps of a specific interaction. For example, the time difference between painting the next frame of a webpage when a user presses a key on the keyboard.
In order to find these interactions, Google makes use of event handlers, which record various visual changes on the screen and detect the interactions.
Pro Tip: You can use PageSpeed Insights or the Chrome User Experience Report (CrUX) to check your site’s score on Interaction to Next Paint (INP). You can also use any Real User Monitoring (RUM) provider. Google Lighthouse is yet another open-source tool to check your webpage’s performance.
What is a Healthy INP Score?
It can be difficult to put a label of “good” or “poor” INP score based on the responsiveness of a webpage. Although the focus is to improve the development practices to ensure a “good” INP score, one must remember that it completely depends upon a user’s device capabilities to set realistic development expectations.
This is why Google has set a standard to measure the 75th percentile of the page loads that are recorded by the event handler across an array of devices, such as mobile phones and laptops.
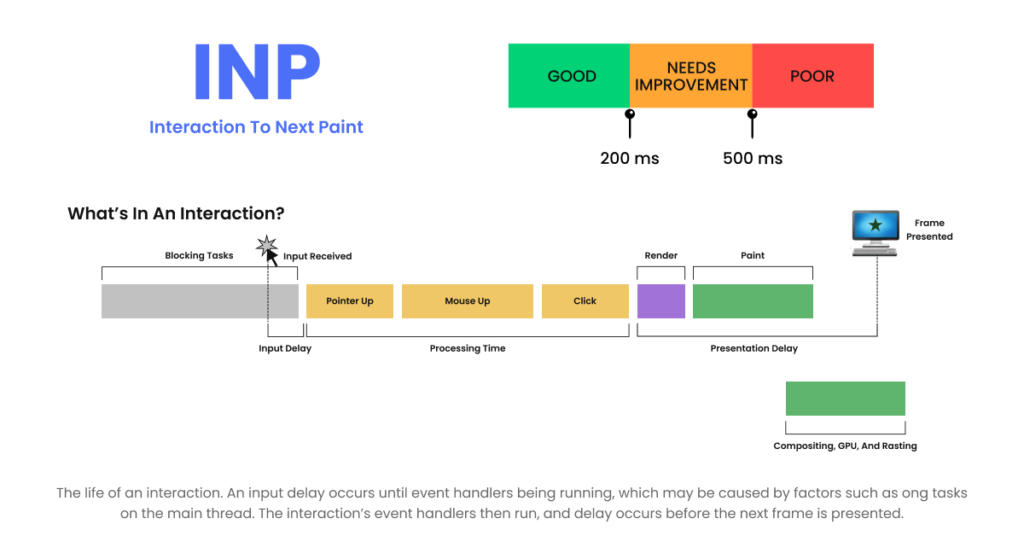
You can find out the responsiveness of your webpage by looking at the following INP scores:
- If your page has an INP of 200 milliseconds or below, it means that your page has good responsiveness.
- If your page has an INP of 200 milliseconds and below or at 500 milliseconds, it means that you need to work on your page responsiveness. It needs improvement.
- If your page has an INP above 500 milliseconds, then your page has poor responsiveness.
What are the Core Web Vitals?
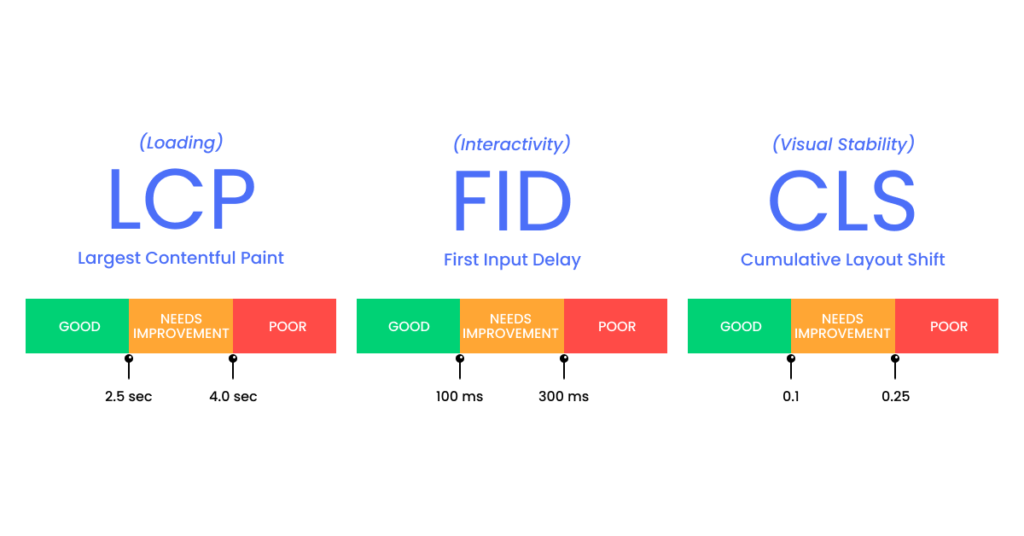
By convention, there are three main Core Web Vitals presented by Google. These are:
- Largest Contentful Paint (LCP)
This metric measures the landing performance of a webpage when a user interacts with it. You need to have your LCP occur within the first 2.5 seconds of clicking the page.
- First Input Delay (FID)
It is another Core Web Vital that measures user interactivity. One must have an FID of fewer than 100 milliseconds.
Note: The Interaction to the Next Paint (INT) metric will replace FID on 12 March 2024.
- Cumulative Layout Shift (CLS)
It is a metric that measures visual stability. One must have a CLS score of less than 0.1 for a good user experience.
What are the Benefits of INP in Search Engine Optimization?
Google’s Core Web Vitals play an indispensable role in enhancing the organic traffic on a website. If a webpage loads quickly and efficiently, it will fetch more users instinctively. However, if the webpage starts lagging, chances are that you need to cross-check your webpage’s Core Web Vitals.
Therefore, these Core Web Vitals consolidate to affect the SEO strategy of a webpage or website in general. Some of the primary benefits of INP are mentioned as follows:
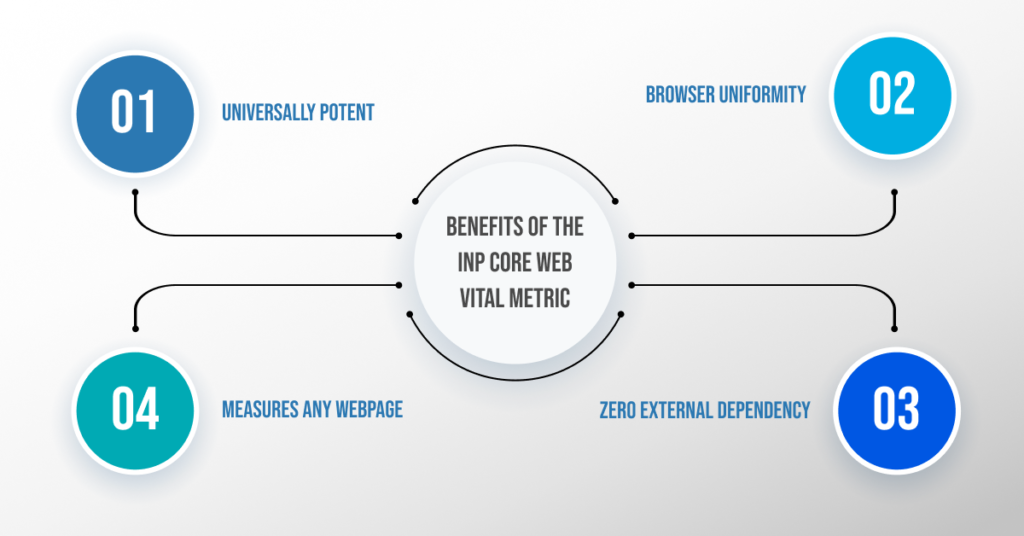
- Universally Potent
The INP metric does not require the assistance of JavaScript or CSS code to measure the responsiveness of a page. It can do it alone for both smartphones and desktop sites. Therefore, this metric is universal in nature, unlike FID (First Input Delay).
- Browser Uniformity
The INP metric does not discriminate among browsers. Does your website work well on Firefox but not on Google Chrome? INP can still measure page responsiveness without depending on the CSS or JavaScript code executed by the browsers.
- Zero External Dependency
As discussed, the INP Core Web Vitals do not depend on JavaScript or CSS code. Apart from this, INP also does not depend on other external factors, such as network latency or rendering.
- Measures Any Webpage
There are no limitations to what kind of page the Interaction to Next Paint (INP) could measure. From gauging the responsiveness of your homepage to any other page of your website, INP can calculate the responsiveness of every type of webpage. Especially if your website page has a lot of interactivity, it can still measure the response rate for the same.
How to Optimize Interaction to Next Paint?
If you want to learn how to improve the Interaction to Next Paint (INP) metric for your website, make sure that you read this section till the end. Although optimizing INP is a time-consuming task, it is definitely rewarding.
Before optimization, it is crucial to figure out the root cause of the delay in the webpage’s responsiveness. You can perform the root-cause analysis by following the below-mentioned steps:
1. Label Your Website First
Before jumping to optimization, it is important to learn if your website has poor responsiveness or just needs improvement. Once you figure this out, you can begin running diagnostics on the slow interactions.
You can use a RUM provider which will equip you with the following information:
- Your page’s INP value
- The specific interaction responsible for the resultant INP
- The time frame of the interaction (if it occurred during or after the page load)
- The type of interaction (tap, click, or a keypress)
- Other valuable information
Pro Tip: We prefer RUM over CrUX as CrUX does not provide contextual data to help you analyze the issues for a high INP score.
2. Run Diagnostics Using Lab
Once you’re equipped with the field data, you can start with the manual testing in the lab. If you cannot find the field data, you can check out this resource.
One of the best methods to manually perform an INP test for interaction latency is to use the Web Vitals Chrome Extension. Once installed, you need to go to the extension’s settings to enable the Console Logging checkbox and then click on Save.
You can then open the console in Chrome DevTools to start testing the suspected interactions on your website. You can also take the help of the useful diagnostic data that appears on the Console.

Pro Tip: If the Chrome extension gets blocked, you can copy and paste some JavaScript into the DevTools console.
3. Optimizing INP
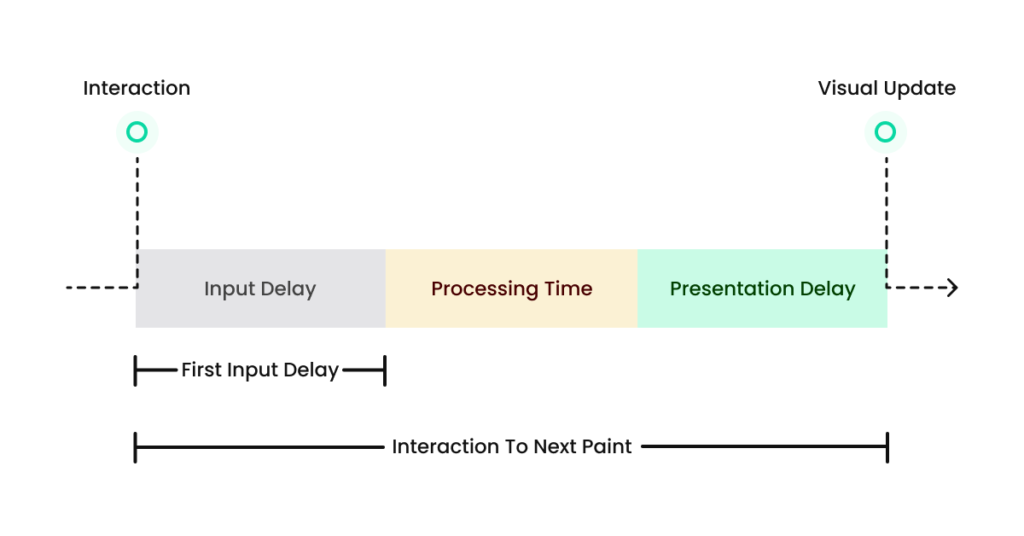
Once you have recognized the slow interaction and run diagnostics in the lab, it is time to optimize Interaction to Next Paint. There are three main types of interactions that need to be optimized. These are:
- The input delay
- The processing time
- The presentation delay
a. Reduce Input Delay/TBT
The first part of the interaction when a user interacts with a page is called the input delay.
You need to reduce and break up the background CPU activity in order to reduce input delay to the minimum. The input delays are caused due to the following reasons:
- Activity happening in the main thread (script loading, compiling and parsing)
- Timer functions
- Fetch handling
- Interaction overlapping
You can also look at the total blocking time (TBT) metric. It refers to the response rate of your website to the user input. In other words, it measures how much time the main thread is blocked during page load. Most of the time, long-running CPU tasks block the page’s main thread. Some reasons for blocked user interactions are:
- JavaScript execution
- Parsing HTML
- Updating page layout
TBT makes up to 25% of the total performance score in Google Lighthouse.
Pro Tip: You can remove the unused JavaScript and CSS, which are not parsed or compiled when not required.
b. Optimize Event Callbacks
Next, you must ensure that the event callbacks that run in response to the user interaction must be completed as fast as possible. You must try to break up the work in event callbacks into separate tasks. You can use SetTimeout to break up the tasks.
Performing this separation prevents the main thread from getting blocked. This practice allows other interactions to take place.
c. Prevent Large, Complex Layouts and Layout Thrashing
Also called forced synchronous layout, layout thrashing is a rendering performance bottleneck where layout happens synchronously. This problem arises when you update styles in JavaScript and request the values in the same tasks. This forces the browser to do synchronous layout work.
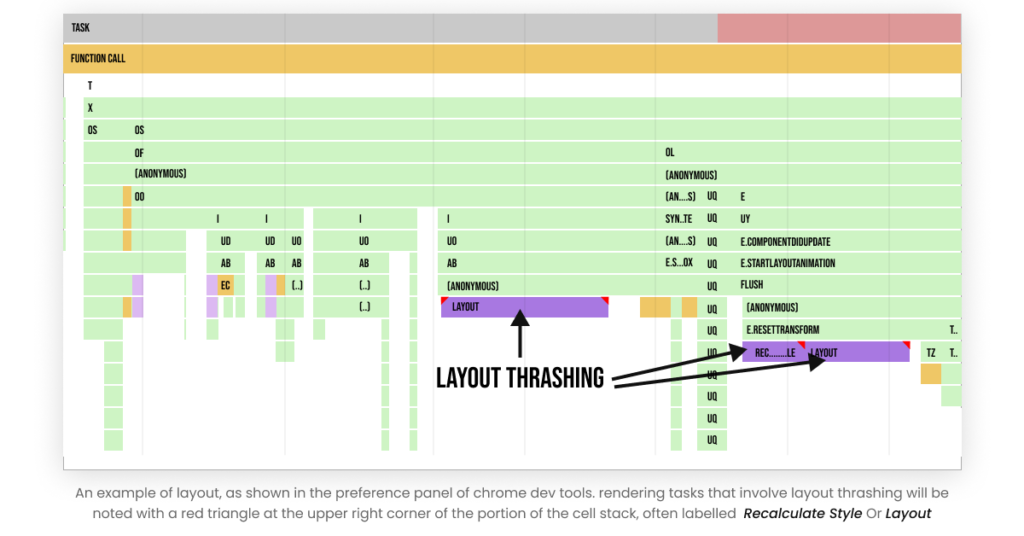
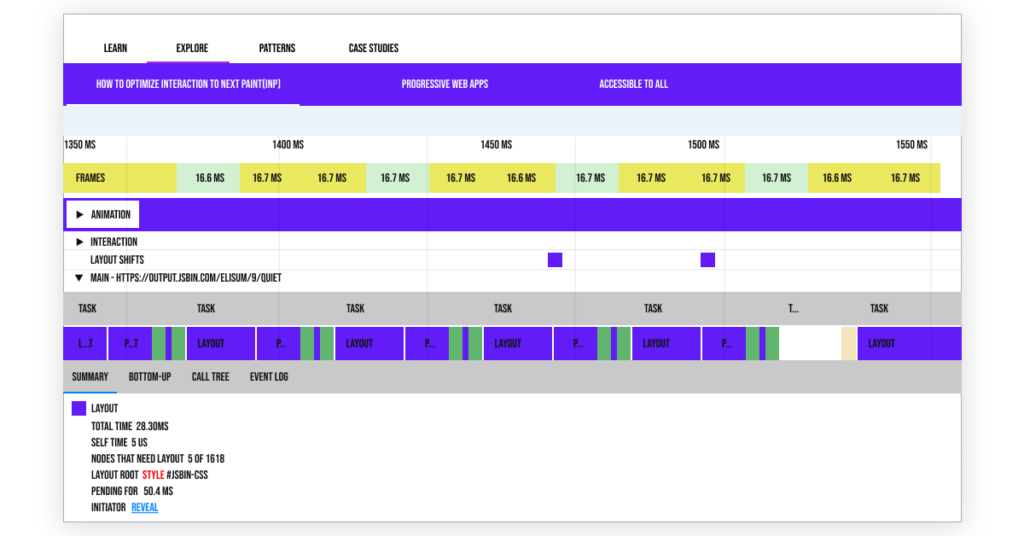
You can avoid the layout; however, if it is not possible to avoid the layout, then you can go to Chrome DevTools to check the time it is taking. You can see the overview of how your site performed by following the steps:
- Open DevTools.
- Go to the Timeline tab.
- Hit the record button and interact with the pertaining site.
d. Reduce DOM Size
A browser creates a Document Object Model (DOM) when a web page is loaded. Large DOM size affects the website’s user interactivity, as it increases memory usage, slows down layout rendering, and causes longer style calculations. Therefore, it is pivotal to reduce the DOM size.
You can finish off rendering work easily by minimizing the size of the page’s DOM. You can follow the below-mentioned approaches to reduce DOM size:
- Flattening the DOM
You can reduce the DOM size by reducing the DOM depth. You can check if your DOM is unnecessarily deep if your markup looks something like the following:

You can open the Chrome DevTools and go to the Elements tab to check the DOM depth.
Another way to reduce DOM depth is to use fragments in the framework that you use.
- Add to the DOM during User Interaction
Another approach to minimize your page’s DOM is to remove the invisible parts of your page when it gets rendered by a user for the first time. You can add them later. This will make the initial HTML load lighter; therefore, it will be rendered easily. You can also initially hide some parts of the page, which can also speed up other interactions.
Real-World Use Case of INP Core Web Vital
Now that you’ve learned in-depth about the INP metric, it is time to look at some of the real-life implementations of INP. Let’s go over a case study of a real website that made massive improvements to responsiveness for the users by harnessing the INP. We’re talking about the Economic Times. (source: Chrome for Developers YouTube channel)
The Economic Times began its work in the Lighthouse, which helped them cut down their total blocking time. It is correlated to INP as main thread slowdowns are the root cause of slow user interactions.
Next, they also lateloaded scripts that were not business-critical to free up the main thread in order to process the main content. They removed unused JavaScript and CSS, which were still parsed and combined even when they were not needed.
“As a part of the process, they inlined necessary CSS, because over 90% of their common CSS was not getting used”, says Annie Sullivan, Software Engineerat Chrome Web Platform team. She then added, “This made a big improvement and they kept going. Once they had optimized the total blocking time, they looked for things that would specifically improve interactions.”
The Economic Times then reduced the DOM size. This helped them reduce the time it took to render an interaction. They also avoided unnecessary rendering by upgrading to Next.js to take advantage of better React hooks to prevent rendering. They also used the request title callback to render below the full content when the main thread is freed up. Party Town was also used to move third-party code off the main thread.
After all these optimizations, the Economic Times saw INP on their Topics page reduced by 75%. They also saw a 50% decrease in bounce rate and a 43% uplift in page views.
Bottom Line
Interaction to Next Paint is one of the next Core Web Vitals that is all set to replace the First Input Delay (FID) metric. With the changing dynamics of the industry, it is time to get familiar with this metric to gain an edge over your competitors and for an enhanced user experience.
You can follow the highlighted techniques to optimize your webpage for the INP metric. Improving the responsiveness of your webpage is a primary factor in deciding the amount of traffic you’ll attract. This phenomenon directly impacts your brand’s revenue.
We recommend you invest judiciously in technical SEO, and if you struggle to do so, Deftsoft’s digital marketing experts are here to cater to you with bespoke Core Web Vitals solutions.
FAQs:
What does INP mean?
Interaction to Next Paint (INP) is a new Core Web Vitals metric that is replacing the old First Input Delay (FID) metric. It measures a web page’s responsiveness whenever a user interacts with the page. It observes the latency of all the interactions made by the user. A low INP score of below 200 milliseconds is a healthy INP score.
What is the difference between INP and FID?
FID is a load responsiveness metric, whereas INP is more than measuring the first impressions. FID considers only the first interaction with the page, but INP considers all the interactions. INP is a more reliable metric as it samples all the interactions and then presents the value, unlike the FID metric.
How do we measure INP?
One of the best ways to measure INP is through tools. You can use PageSpeed Insights or the Chrome User Experience Report (CrUX) to check your site’s score on Interaction to Next Paint (INP). You can also use any Real User Monitoring (RUM) provider.
What to do if no INP value is reported?
There could be several reasons why you were not presented with an INP value. These include that the user did not interact with the page through clicks, taps, or keypresses. He simply hovered or scrolled through the page. It could also be because a bot, such as a search crawler or headless browser, is interacting with the page.


Shamsher Singh Bhullar
 2nd March 2024