Data Visualization – A Smart Investment for Your Big Data Analytics Success
-
By Paramjit Singh
-
10th February 2017
The term Data Visualization is hitting the minds of millions at the present times, where there is no room for the companies or organizations without the knowledge and skills of presenting their business in the highly defined and persuading manner.
Today, it is imperative for every business personality to walk hand-in-hand with the technology and the latest business trends to achieve the heights of success. Unfortunately, if you lack somewhere, then it’s a matter of worry for you that how to stand out in this competitive world.
The idea of utilizing the pictures to illustrate the information has been used for years. Here, if we take an example from our daily routines in homes, i.e. reading a newspaper, then for sure, no one can go through with the paper. Most of us usually get an idea of the news through the beautiful pictures or read only a particular story that offers the alluring pictures. And now, with the passing years, it has evolved as a technology which is known as ‘Data Visualization’.
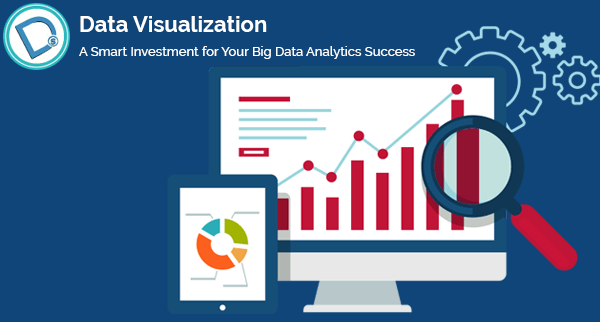
If we go deep into the topic, then Data Visualization is a technical term used to depict the information of data through pictorial or graphical format. Patterns, statements, and expressions that may go undetected in the content based information can be uncovered and perceived simpler with this Data Visualization technology. This advanced innovation has taken the understanding of complex data a step further to extract the details easily.
This has made it conceivable to process a lot of information at lightning fast speeds. These days, Data Visualization has turned into a mixture of science and art that is sure to change the corporate world throughout the approaching years. According to the experts, to achieve success with Data Visualization is generally a matter of keeping the things simple by adopting the new thinking of presenting the information.
So, let’s discuss the business benefits of Data Visualization that helps you to reach the pinnacle of success with the efficient management of your business information. With every passing year, the amount of data being created is enormously increasing at very high pace, that it becomes difficult to identify the necessary information. However, all these data produced by employees or devices are meaningless until and unless they are not organized or arranged properly to bring an insight value. Thus, it is advisable to use visualization techniques and tools at your workplace to grasp only the essential information hidden in the collection of files.
The technology enables users to discover relationships and various patterns between organization’s operations and performance. It’s less demanding to perceive how your everyday errands affect your general business execution and discover which operational change set off the development/dunk in business execution. Using this technology, you will be able to compare your present performance with the past and can help your business to do well in future.
Data Visualization also helps you to identify the emerging trends quickly and even can spot changes in customer behavior and market conditions. The amount of information using this technology, a company could gather, provides key insights into the business and return opportunities.
If you have never thought of getting interacted with the details, then you are lucky here. It empowers you to convey noteworthy bits of knowledge to the surface. Unlike various tables and charts which must be seen only, data visualization tools empower clients to interact with the information. For example, an excel sheet or canned report only tells you that your sale for a particular product is down for this month. But, using real-time data visualization, you can get the sales figures, details for why your product is under performing and the reason for the drop in sales.
It is imperative to simplify the information to help you being getting lost in the stack of data. Take advantage of Data Visualization to sort out your necessary information from a huge dark forest. Empowering your employees with data visualization brings a new way to execute your business operations more effectively and drive better sales and performance.
Recent Articles

Paramjit Singh
 10th February 2017


